Meteonorm typical years
Here you can download demo datasets generated with Meteonorm. The files contain typical years for the city of Bern, Switzerland (location type: city). Data of this kind can be generated with Meteonorm for any location worldwide. Alternatively, you can order datasets directly from us.
Irradiation maps
Below you can view demo maps of global radiation which have been produced using Meteonorm algorithms. You can order maps according to your specifications directly from us. In collaboration with PV Europe, we produce monthly updated irradiation maps of Europe, have a look!
Maps showing the difference in irradiation for different versions of Meteonorm can be found here.
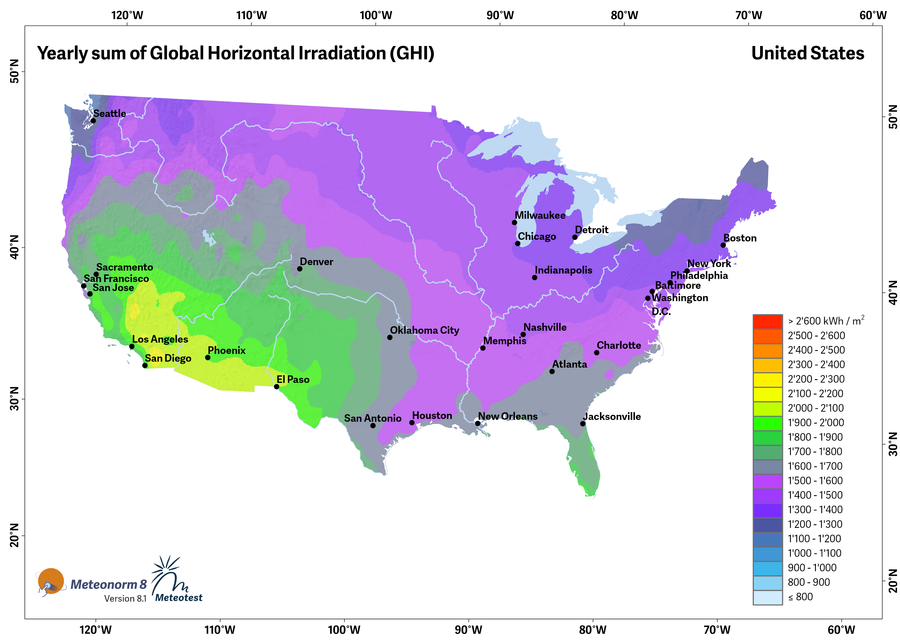
USA - Yearly sum of global horizontal irradiation (1996–2015)
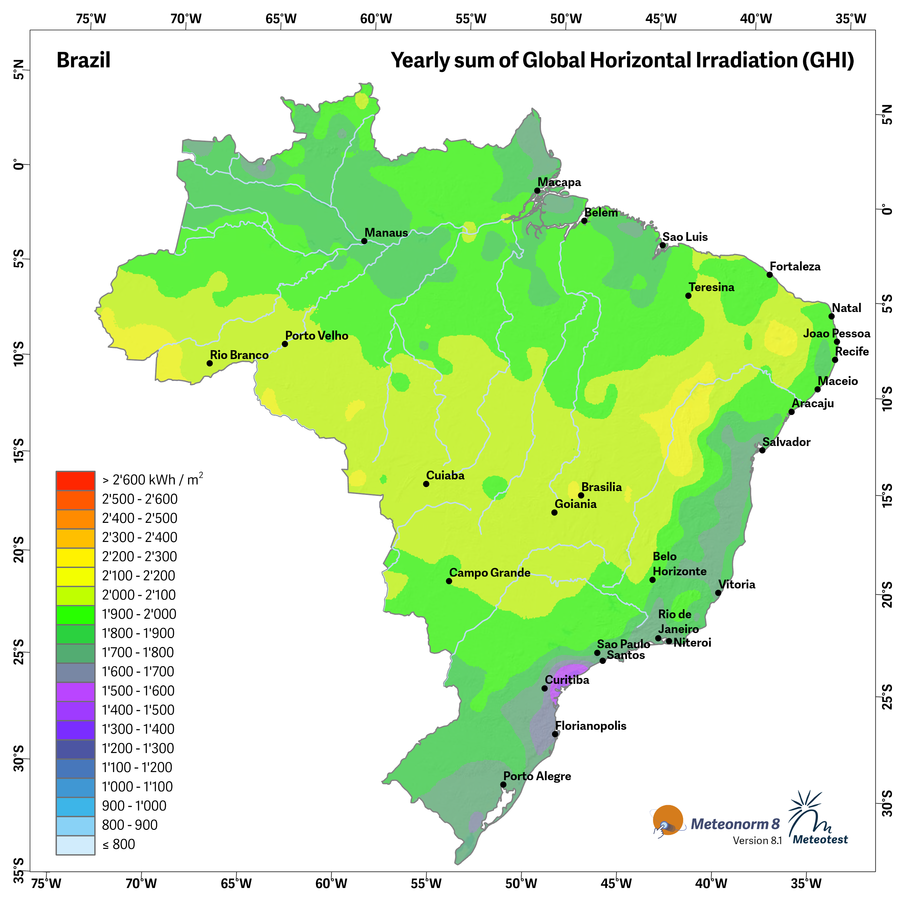
Brazil - Yearly sum of global horizontal irradiation (1996–2015)
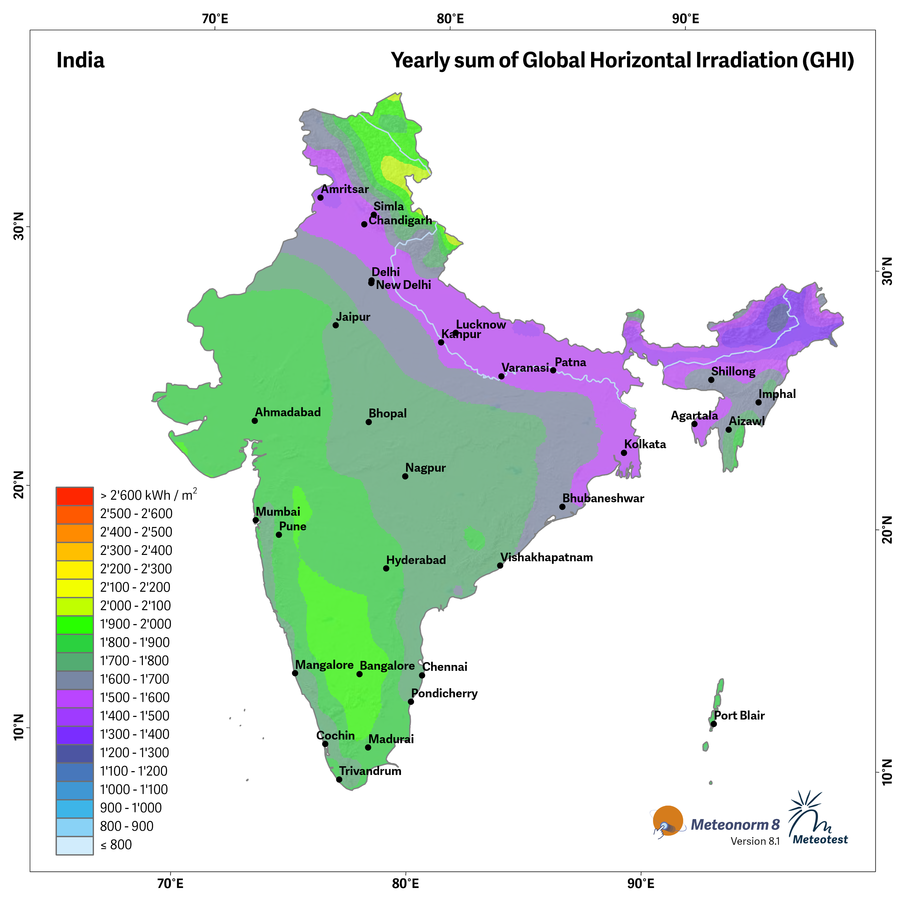
India - Yearly sum of global horizontal irradiation (1996–2015)
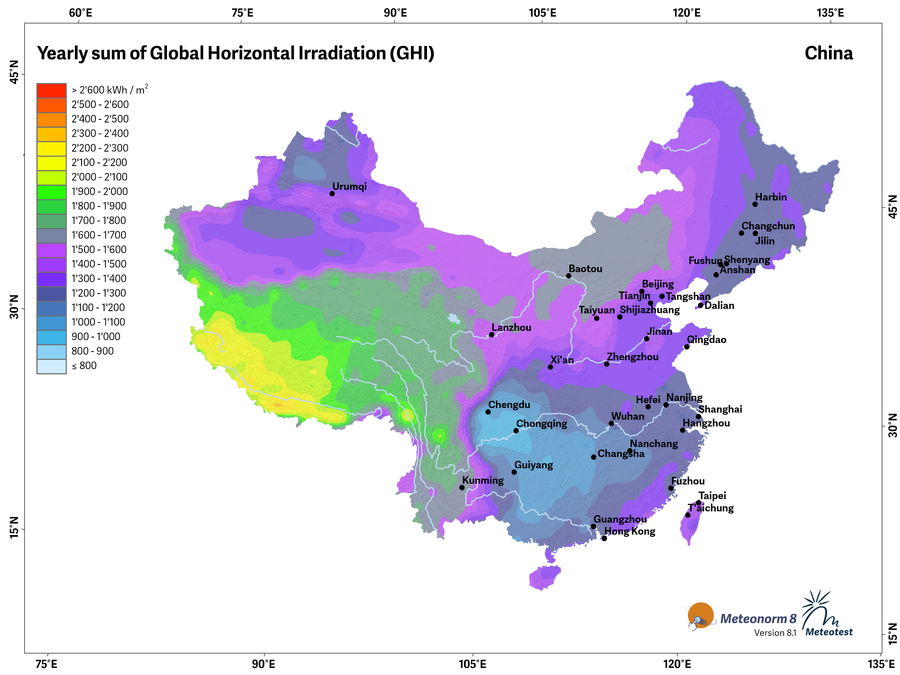
China - Yearly sum of global horizontal irradiation (1996–2015)
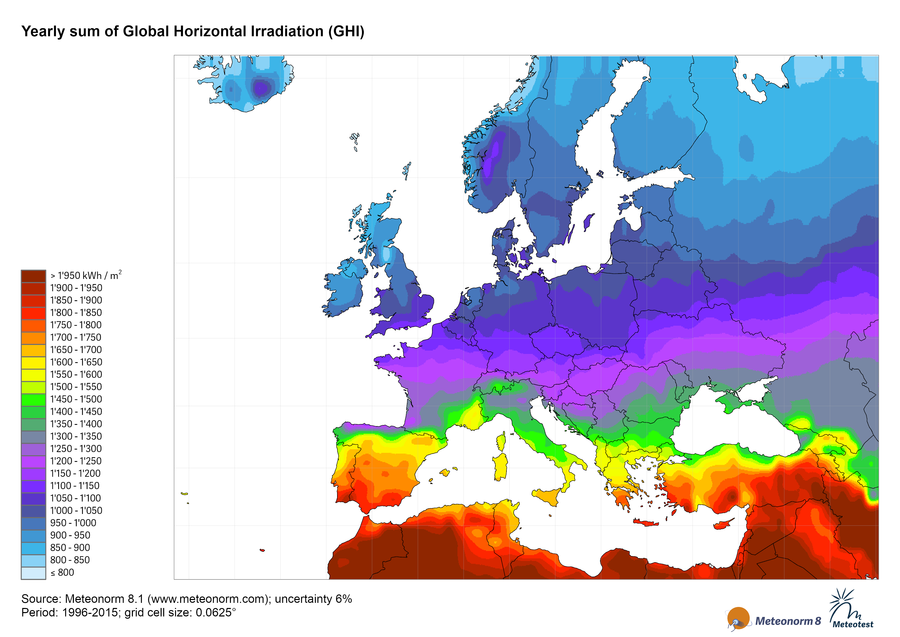
Europe - Yearly sum of global horizontal irradiation (1996–2015)
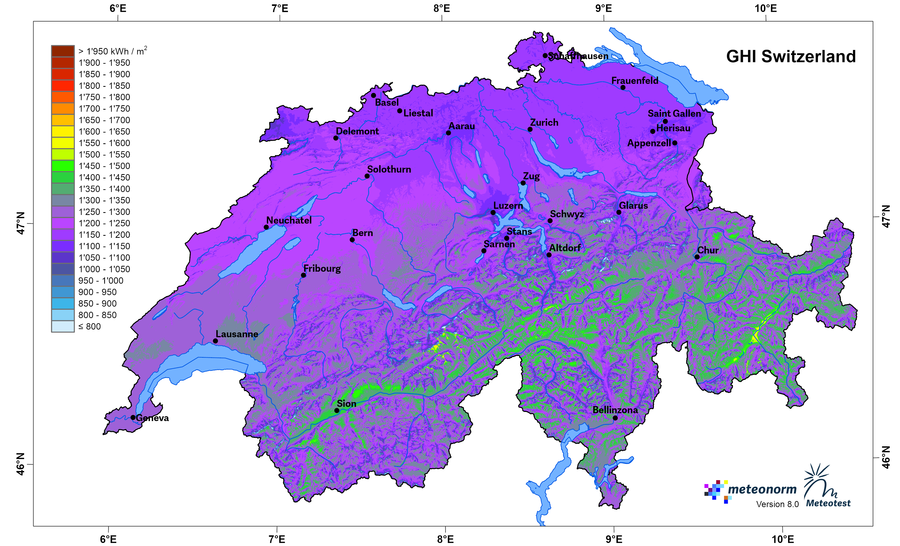
Switzerland - Yearly sum of global horizontal irradiation (1996–2015)
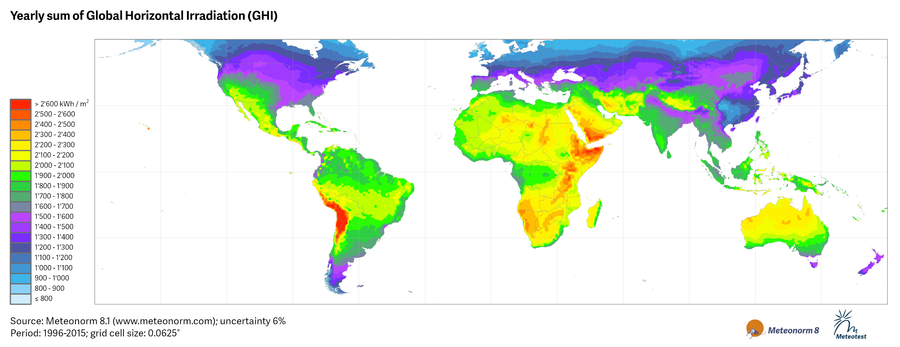
Yearly sum of global horizontal irradiation (1996–2015), grid cell: 0.0625°
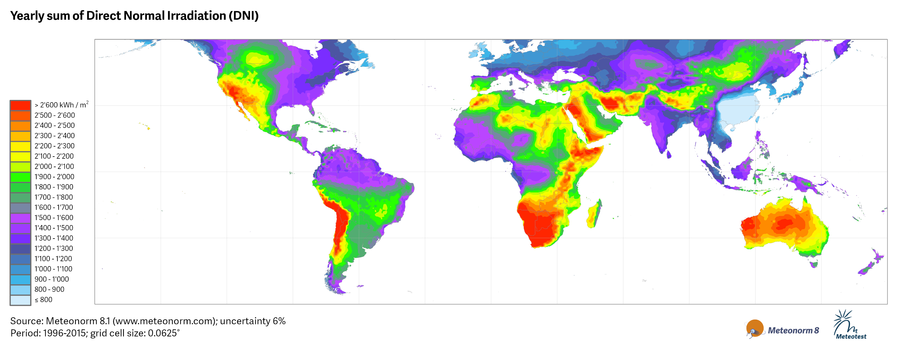
Yearly sum of direct normal irradiation (1996–2015), grid cell: 0.0625°; approximation to Meteonorm software results